Dr Laura Russo, post-doctoral Marie Skłodowska-Curie Research Fellow, working on how agrochemicals affect plant-pollinator interactions, describes her first foray into soil analysis…
After discussing my experimental design with collaborators at Teagasc, I realized it was essential to establish the background composition of the soil, to determine whether a) my treatment had an effect on the soil composition over time and/or b) whether the background soil composition at my different sites influenced the health of the plants and their response to my experimental treatments.
For this reason, I took soil samples from each plot at each site in the spring before treatments were applied and then resampled all of the plots at the end of the season after the last treatments of the year were applied.
Thus armed with many kilos of soil samples, I waddled into the soil lab at TCD. I put on a lab coat, latex gloves, and safety glasses, then, under the expert tutelage of Mark Kavanagh (Botany Technical Officer), I conducted some basic analyses on these soil samples:
- pH
- Total organic matter in the soil
- C and N content of the soil
- P and K content in the soil
The first step to any soil analysis is to air dry the soil samples and sieve them through 2 mm sieves. This removes any large rocks and helps to break up chunks of soil. Don’t underestimate how long this step will take (if you’re doing it by hand)! To process my 32 samples, I spent a few hours a day for about 5 days sieving soil samples.
The next step is to get the soil really dry using a drying oven set to 100C for 24 hours. It’s important to measure how much water (through weight) is lost during this drying step, as you may need that to back calculate future analyses on air dried soil samples, which still have some moisture in them due to humidity in the air.
After those preparatory steps, I took the pH of the sieved and air dried samples. To do this, I measured 1 part soil to 5 parts distilled water and put them on a shake table for 60 minutes. After letting them rest for 10 minutes, I took the pH of each of these samples using a calibrated pH probe.
An important thing to note here is that it’s a good idea to subsample your soil samples to see how much variation there is within a given analysis. Obviously, if there’s more variation between subsamples within a sample than between different samples, that analysis is not revealing any meaningful variation between sites or treatments.
I used the oven-dried samples to then measure the total organic matter in the soil, keeping them in a desiccator while weighing them out to ensure that they didn’t absorb any moisture from the air (which would artificially inflate the organic content by making them heavier). Once the samples are weighed into crucibles, they can be placed in a furnace at 500C for 3 hours.

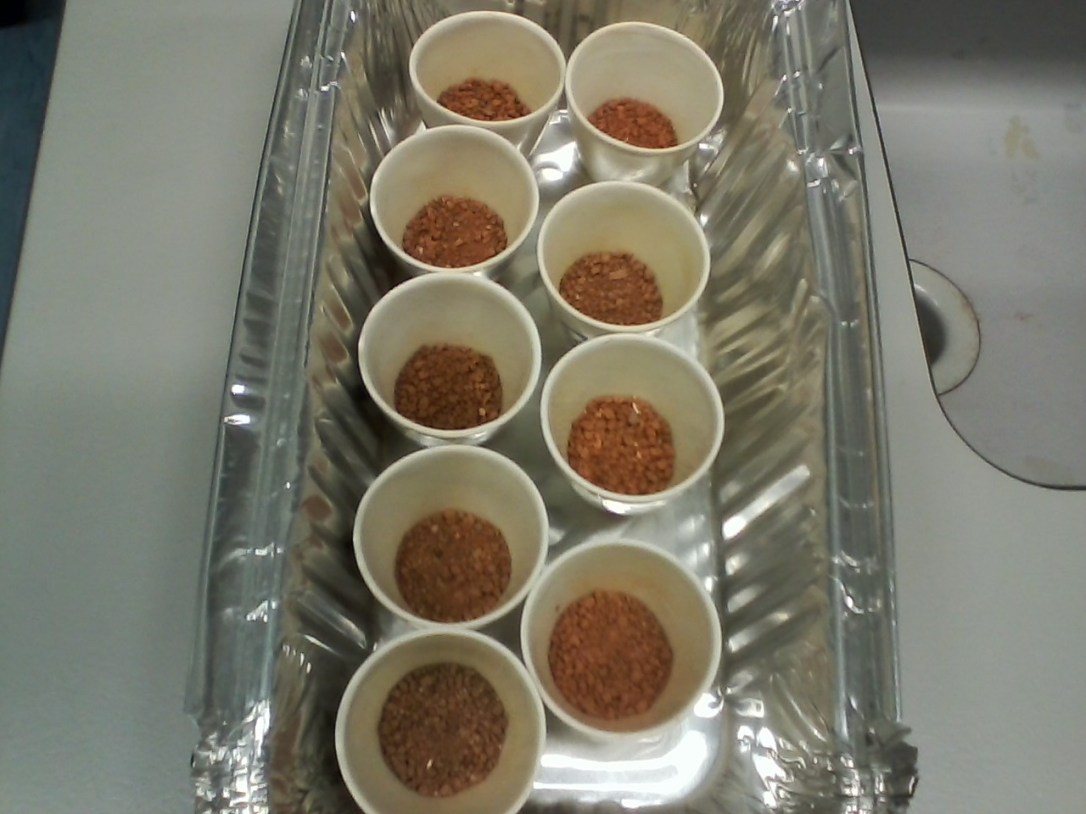
The most interesting thing about this step was that before the samples went into the furnace, they varied in colour and texture (Figure 1), suggesting there was a variety of soil compositions. However, after they were cooked in the furnace, burning off all organic matter…
They all changed to the same colour! This visible change was really striking to me, not only because they looked so different before and after, but because after the furnace all the variation between samples disappeared. That suggests to me that the colour variation was all due to organic matter, which is just cool.
The next analysis I did was on the total carbon and nitrogen content of the soil. To do this, I had to mill all my samples to a fine dust. To do this, I measured out a known weight of air-dried soil into bowls with zirconium oxide balls, and then put them in a ball mill. The mill spins the samples around at 650 rotations per minute for two minutes…in other words, really fast! The bowls have to be very securely fastened in the mill or they can explode out of it. Fortunately, that did not happen with my samples. They were all well-secured and milled into a very fine powder.
This fine powder was then measured into tiny tin cups, which was dropped into a vario TOC cube, which measures nitrogen and carbon content by means of high temperature digestion.
Finally, I measured the amount of P and K in the soil by doing a nitric acid digestion of the oven-dried soil samples. For the nitric acid digestion, I weighed a known volume of dried soil into glass tubes and then added 10mL 69% nitric acid. These tubes were left to cold digest for 24 hours, then they were boiled at 120C for 2hr and 140C for 1hr.
After all the samples cooled, the compounds of interest were in the supernatant, so I filtered the soil out and diluted the samples to 100mL with distilled water. This step was really interesting because of the beautiful colours that appeared.

Not only were these colours aesthetically appealing, they also correlated strongly with site. Two of the sites were orange, one was pale yellow, and one was bright red! These colours are likely related to metals in the soil (for example, iron shows up as red).

Stay posted if you want to hear more about the results of my analyses!
